SUMMARY
Learn how to download and interpret the Comparative Production Report.
Introduction
The Comparative Production report allows you to measure seasonal performance company-wide, by Location, or by agent for any given month across multiple years, as well as totals for each year. Monthly and annual figures are included for Sales Volume, Sales Average, number of transactions, and (for Commission Module subscribers) Sales Units.
Who Can Do This?
Only admins with permission to Enter Financial Data or View Financial Reports have access to run the Comparative Production report.
Video 🎥
4:23
Download a Comparative Production Report
To download a Comparative Production report:
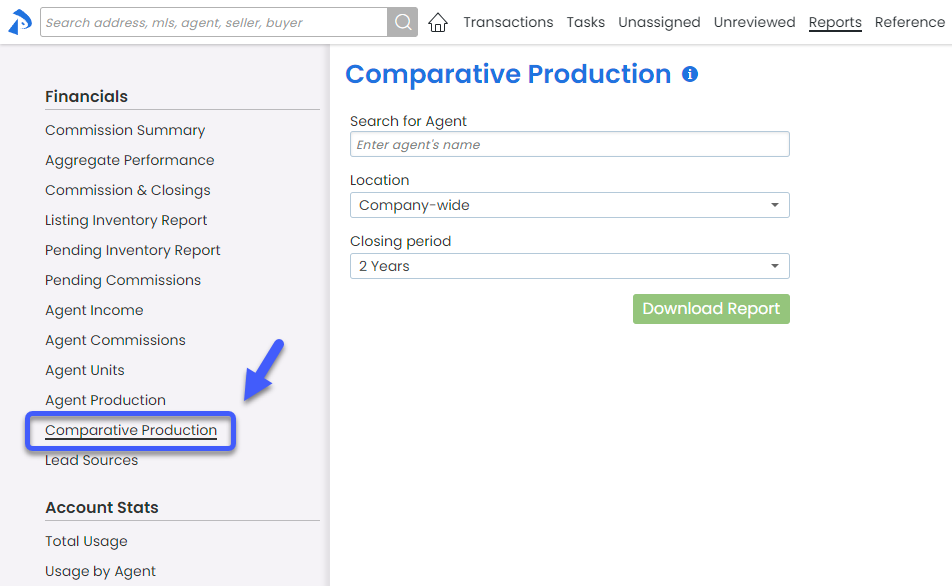
- Click [Reports] from the top menu.
- Click [Comparative Production] from the Financials section of the left menu.
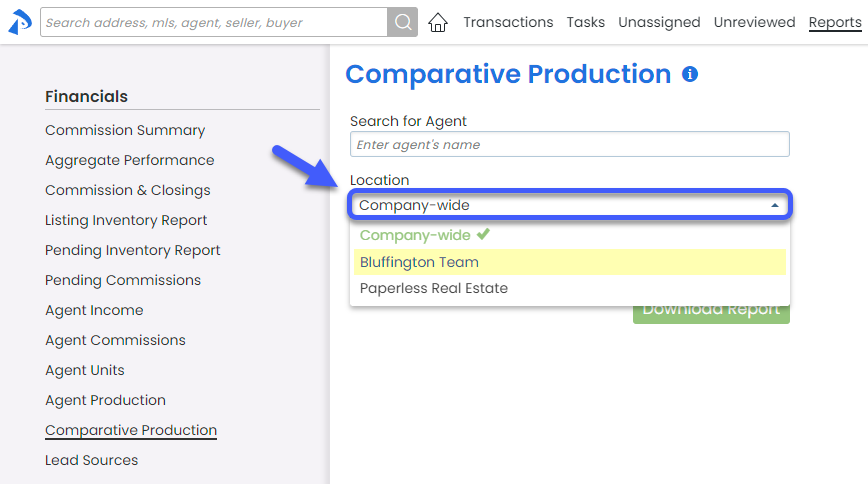
- If your company has more than one Location in Pipeline, select your desired Location from the dropdown list. By default, Company-wide is selected.
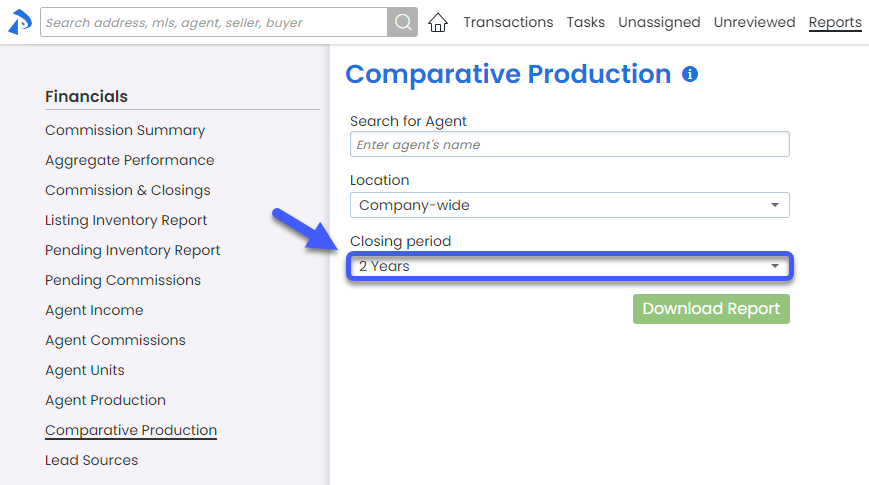
- Choose your desired Closing Period range from the dropdown list. By default, 2 Years is selected.
- Optionally, run the report for a specific agent. LEAVE THIS FIELD BLANK TO RUN THE REPORT FOR ALL AGENTS.
To run the report by agent, start typing the agent's name then select the agent when they appear in the dropdown menu.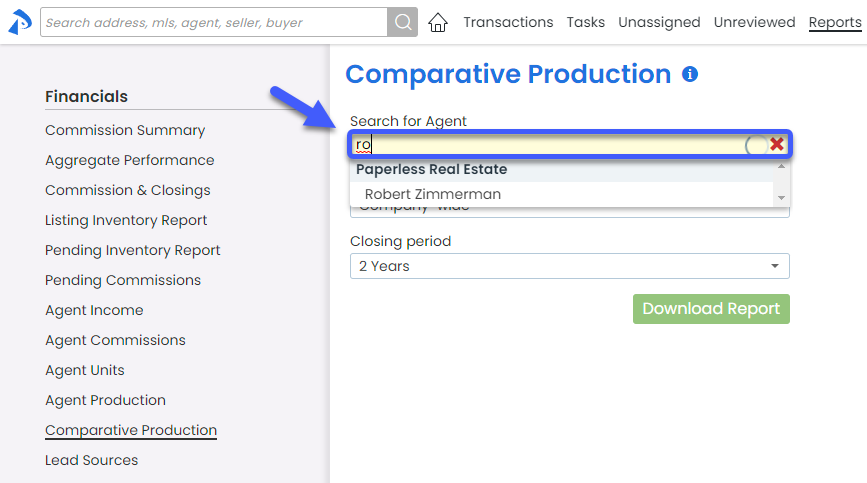
- Click [Download Report] to download the report to your computer.


View the Download
To view the downloaded Comparative Production report:
- Open the saved report in your preferred app for spreadsheets.
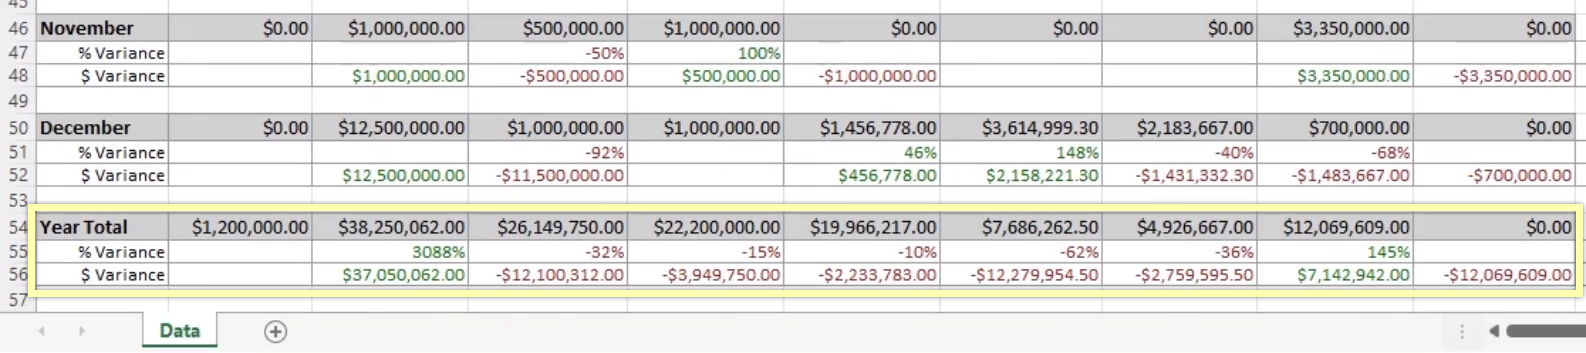
The report will include separate sections to compare Sales Volume, Sales Average, Transactions Closed, and Sales Units.
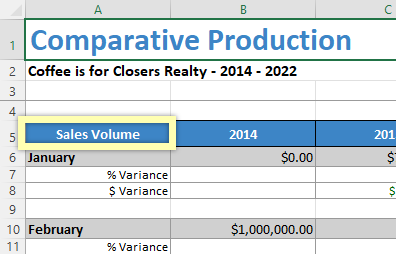
Each section of the report will include:
- Separate columns for each year within your selected Closing Period.
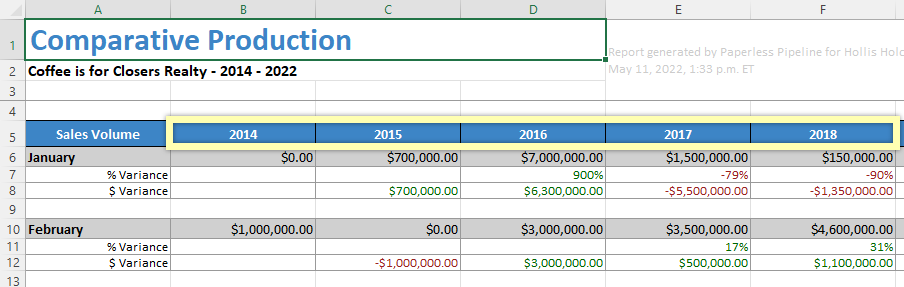
- Separate rows for each month's totals including the total amount, and the amount of variance from the month in the previous year.
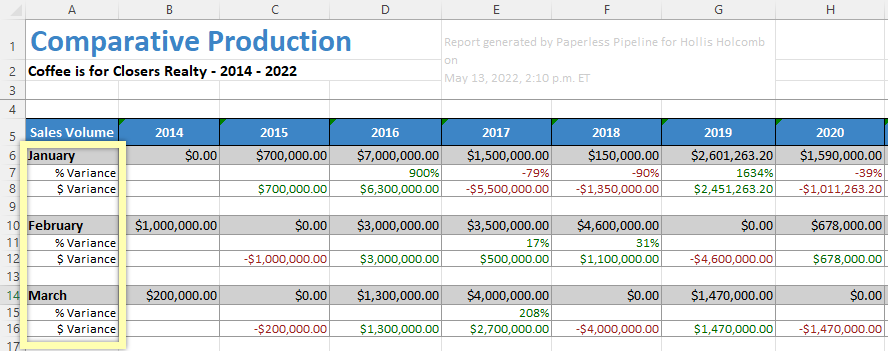
- At the bottom of each section, a row for each year's totals including the total amount, and the amount of variance from the previous year.